You can spend several hours creating a beautiful design for your Google Docs Venn Diagram from scratch. But if you want to make your life much easier, the right way is to use a ready-made template. After easily editing you will get an attractive desired result with minimum effort.
2 Circle Venn Diagram Template (Two sets)
Effortlessly compare and contrast two sets of data with our 2 Circle Venn Diagram Template. Choose between two unique styles, including a classic strict blue color scheme perfect for corporate documents, and a vibrant multi-colored option complete with informative footnotes. Download the template by the link below and streamline your data visualization process!

3 Circle Venn Diagram Template (Three sets)
Visualize the relationships between three sets of data with ease using our 3 Circle Venn Diagram Template. Choose from multiple designs to find the perfect fit for your project. Whether you're creating a business presentation or organizing your research, our template is a valuable tool.
-1.jpg)
Download 3 Circle Venn Diagram Google Docs Template
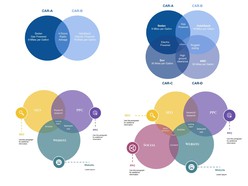
4 Circle Venn Diagram Template (Four sets)
The relationship between four separate groups or concepts can be illustrated with a four-circle Venn Diagram. This type of chart is used less frequently than the 2 and 3 sets.
Since such diagrams are more difficult to understand, a template with explanatory information is more desirable. But if the concept is simple, the first version of the template is also great.
Choose below from a variety of stylish designs to suit your needs, whether you're creating a report or organizing research data. Our template is easy to use and customizable, so you can create a professional-looking Venn diagram in no time.
-1.jpg)
Download 4 Circle Venn Diagram Google Docs Template
FAQ
How to Choose the Venn Diagram Template Style That's Right for You
To make a stylish Venn Diagram, you need to follow 3 main tips:
- The design of your diagram should be clean and easy to convey the idea of what it was created for. Try not to use complex types of diagrams in which small details will not be clearly visible.
- Use styles that match your document. Color tone and fonts should blend harmoniously with the overall design of the document.
- Add small explanations next to the diagram to make the conclusions easier to understand. Any infographic is difficult to understand at first glance, but when a person understands it, it becomes a key and satisfying factor.
How to Make a Venn Diagram on Google Docs from Scratch
More and more people create their documents in the convenient environment of Google Docs. Often the question arises of how to create an attractive Venn Diagram in it. The simplest method is to use pre-made templates, but also it's easy to create them from scratch.
For creation, use the Drawing Tool that is built into Google Docs. Here is a step-by-step guide:
- In Google Docs click the top menu Insert button and in the dropdown select Drawing.
- In the Drawing window select the top menu Shape button. Select Circle and draw it. Tip: hold the Shift button to make it the correct form.
- Change the color of the circle using the palette in the top menu. Make it semi-transparent to see the intersections with other circles.
- Add text boxes and icons as needed, and click on the Save and Close button.
How do you make circles overlap in Google Docs?
You need to drag one circle on top of the other in the Drawing window to intersect them. All circles need to be colored transparent so that the intersections are clearly visible.
More useful templates can be found in our Google Docs Collection.
How to Make Venn Diagram Look Good and Professional
- Prior to beginning to create your diagram, choose your main points. Venn diagram should clearly illustrate commonalities or differences between two sets of data.
- Try out several colors, but make sure your text has a good contrast so it can be read inside the circles.
- Use a simple typeface so that your viewers won't have to strain their eyes to understand what each circle in the Venn diagram symbolizes.
- Use relevant images or icons on the diagram.
How to start editing the Google Docs Venn Diagram template?
To start editing a template, make a copy of the document File > Make a copy. To edit blocks with images, double-click on them to open the Drawing tool.